The Daily Brew
- infographic design
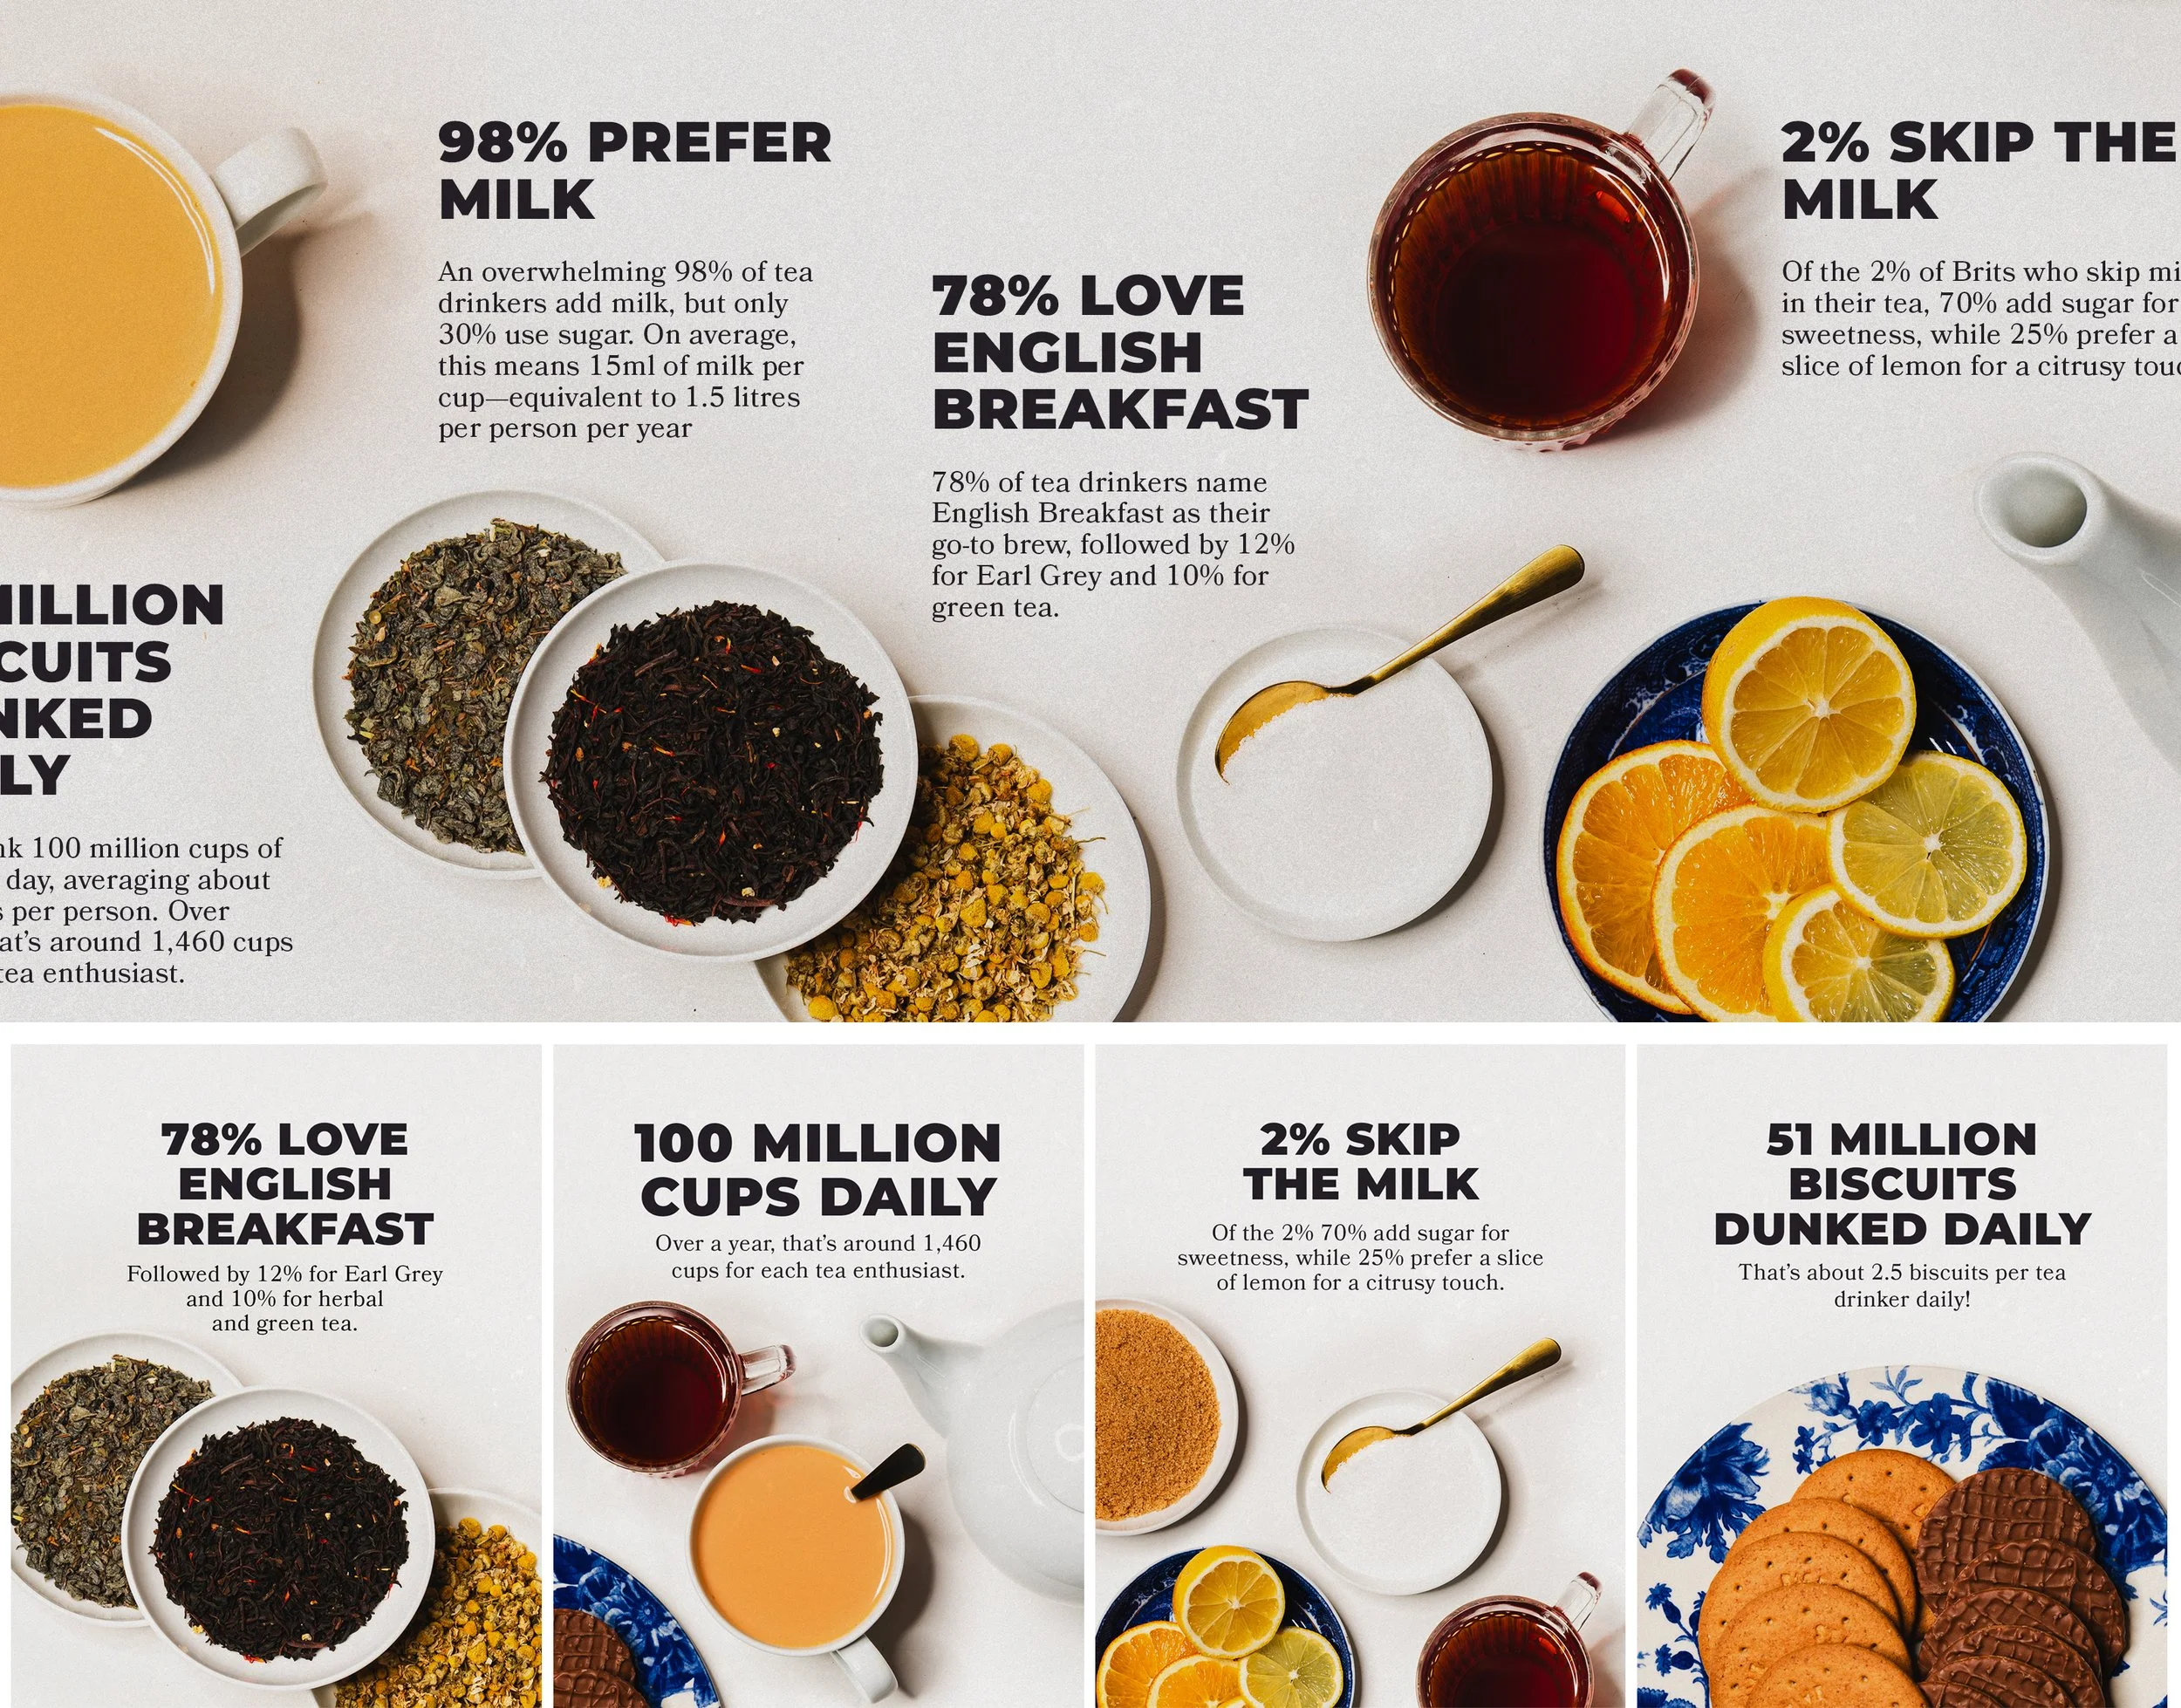
From the morning cuppa to the afternoon tea, the UK’s tea-drinking habits are as steeped (pun intended) in tradition as they are in numbers. This infographic dives into the stats behind the people’s love affair with tea, uncovering just how much we sip, dunk, and pour every day. Discover how many of us take it with milk, sugar, or even a slice of lemon.
To keep the imagery following the copy layout, I decided to take all the photos for this infographic myself. While this added a significant amount of work to the process, it has proven to be a worthwhile investment, providing me with unique resources that can be adapted to suit any layout or media.
Please note:
The data presented in this infographic has been compiled and summarised by an AI language model (ChatGPT) for illustrative purposes. While efforts have been made to ensure the figures are engaging and reflective of general trends, they may not represent precise or official statistics.


